If you pay attention to the weather, you don’t have to wait very long to hear news of extreme rainfall or flooding. Such events are common around the world, the United States has its fair share each year. During 2019 severe flooding has occurred in the Mississippi river basin. In some locations this activity has been ongoing for three months, and even exceeded the severity of the 1927 ‘Great’ flood (see this link). During May of this same year, focus turned to the Southern U.S. Repeated episodes of strong thunderstorms and severe weather produced substantial flooding across Oklahoma, Kansas, Missouri and Arkansas. In Oklahoma, at least 6 fatalities and 118 injuries were attributed to flooding and severe weather, and a disaster declaration was issued for all 77 counties. The most extensive flooding occurred along the Arkansas river, inundating smaller towns, isolating others, and threatening the Tulsa downtown, although the city’s levee systems performed as designed and mitigated the threat (Oklahoma Mesonet).
While floods are common, there is concern that the warming of our planet is leading to an increase in the frequency of these events. Now, for context, remember that a human lifespan is short in comparison to the atmospheric and hydrologic variability that can occur (and the lifespan of social media and 24-hr news is even shorter!). Our short memories often preclude us from realizing that catastrophic flooding is a normal, albeit extreme, feature of our planet. Nevertheless, it is well established from scientific research (CCSR, 2017) that a warmer atmosphere can hold more water vapor. This is based on an equation empirically-derived equation known as ‘Clausius-Clapyron’ created by some clever folks (Mr. Clausius, and Mr. Clapyron of course – because if you create an equation you get to name it), who simply took what they understood from physics, thermodynamics, and their observations to form this very important principle. The CC equation under typical atmospheric conditions has an exponential temperature dependence. For every 1oC (~ 2oF) rise in air temperature, the water-holding capacity of the atmosphere increases by 7%. If we look around our planet today, we see the regions of greatest warmth near the equator typically also have the highest amounts of precipitable water, although local geographical variations can have a strong influence at regional scales. For all y’all, perhaps you can just think of Florida in the summer as an example of a hot place with lots of water!
Okay, warmer air = more water vapor. Climate change = warmer air. We have a basis for suspecting that in the future, precipitation, and associated flooding, could increase in frequency or intensity. So does that mean its just going to dump rain everywhere? As it turns out, the really complicated aspect of all this is being able to project how much and how often precipitation of various intensities may occur at the regional scale decades into the future. We are highly confident globally that we will see heavier precipitation and a higher degree of variability, but the where, how much, how often questions are much less clear. One big reason for this is that our planet has a whole set of complicated dynamics that drive how or if precipitation systems develop, and when and where they go, on scales ranging from hours to months. Each climate model will represent some of these dynamics a little differently, and so no two models will tell the exact same story. The models are also sensitive to greenhouse gas inputs in different ways, some are more sensitive than others and will warm faster than others. This is all quite annoying because…
WE WANT/NEED TO KNOW!!!
Many people who work in long term planning across all kinds of sectors are aware, or becoming aware, that a changing climate will change many of the criteria they have been used to with respect to how their systems or infrastructure is designed, or where it is situated. Let’s take water resources as an example. If you are planning long-term, you things you may consider are who is expected to live in my service area? what are the anticipated water needs? How can I meet those needs? What hazards much I account for? What resources do I have? While many of these questions do not pertain to climate change directly, there is one that does, and that is the water input to the region through atmospheric processes (precipitation, evaporation).
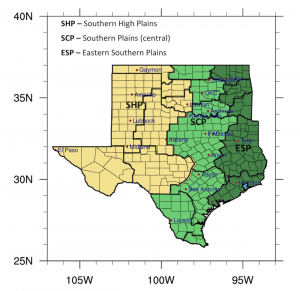
That’s where research from folks like me comes in! There is a lot out there, probably a dizzying amount, but I’m going to spend a minute talking about an approach we took for examining changes in extreme precipitation in a region, namely, Oklahoma and Texas. The paper in question is entitled ‘Quantitative Scenarios for Future Hydrologic Extremes in the U.S. Southern Great Plains’, by Mullens and McPherson and published in the International J. Climatology (a link is posted at the end of this page). This part of the world is very interesting, for a few reasons. From a climate perspective, its defining feature is a large gradient in precipitation from east to west. I used to live in Norman, Oklahoma, which has an annual average precipitation of 35 inches. If you drive along I-40 out to Elk City, about 130 miles to the west, annual average precipitation drops to 29 inches. By the time you get to Amarillo, Texas, you only have about 20 inches. Now go southeast of Norman by 290 miles to Longview, Texas, and you have about 50 inches annually. Because of its large gradient, the region is home to an abundance of different ecoregions, biodiversity, and landscapes. Our question is, how does precipitation change across Oklahoma and Texas in the future, and are there pronounced differences in projections across this precipitation gradient? We regionalize our domain into three sub-domains to account for the gradient (see below, Figure 1).

Figure 1: Sub-domains evaluated in this paper which span the precipitation gradient across the region. State, Climate division and county boundaries are overlaid.
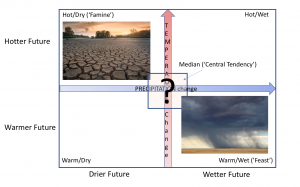
Our approach uses multiple climate models that were statistically downscaled from their parent Global Climate Models, or GCMs. This form of downscaling uses statistical methods to bias correct and increase resolution of surface fields such as temperature and precipitation, making them more usable and relevant to decision-makers at the regional scale. With about 21 models to examine, we employed a simple method that retains the breadth of possible futures across them. This approach is a form of ‘scenario planning’ which is a process used by professionals and scientists to create ‘storylines’ of plausible futures and subsequently evaluate problems and solutions associated with each storyline. Because climate change impacts cannot be precisely predicted, we will never be in a situation where a deterministic, single answer solution is possible. Instead, by evaluating different projected futures, we can examine whether our decisions are robust across them, or whether different decisions would be required for different futures. In this paper, we strictly pose scenarios based on the possible climatic conditions of the future, which is based on the late 21st century change (2061-90) versus the historical period (1971-2000). The Figure below demonstrates our complete set of scenarios, and those we directly examine in this work.

Figure 2: A schematic representation of climate change scenarios used in this analysis, based on model-relative future temperature and precipitation changes in the late 21st century compared to the historical period.
As you see from the figure, our scenarios are based on combinations of temperature and precipitation change. We examine three scenarios from the full set above, namely ‘Hot/Dry’, ‘Warm/Wet’ and ‘Central Tendency’. These reflect two of the most extreme scenarios as well as a third that follows the median of the sample. Finally, we include the ‘Multi-model Average’ of all models used as a fourth scenario. Models were assigned into these categories based on their magnitudes of temperature and precipitation changes in the late 21st century versus the historical period, and the top four models in each category used as the sample for each category. There tends to be the assumption, particularly when not directly using climate data, that a ‘Dry’ scenario is exclusively drier (i.e., for average AND extreme precipitation) and a ‘Wet’ scenario wetter. Is this really the case? Let’s see…
Okay, so enough on the prelude, what were the results?!
I should at this point mention that if you like all the details, caveats etc. those are included in the full article linked at the bottom of this page (if you can’t get access then please email me).
Question 1: How might average precipitation and hydrologic extremes (heavy precipitation AND drought) change across the southern plains (multi-model average & central tendency scenarios)?
All sub-domains indicated an increase in the frequency and duration of drought, with the greatest relative increase projected for the Southern High Plains (SHP) with high greenhouse gas emissions. With lower emissions, there is still an increase in drought frequency, but it is much reduced. Average precipitation in all sub-domains shows reductions in spring and summer, particularly with high emissions. The frequency and magnitude of heavy precipitation increases (which we define as the 5-year to 100-year rainfall accumulation based on extreme value theory) but magnitude is highly uncertain and highly model-dependent.
I shall refer to this result as ‘Feast and Famine’. It depicts a world where average spring and summer rainfall decline by 3-20% depending on sub-region, model, and emissions scenario, and an increase in dry months by around 50% in the mid-21st century (2021-50) and over 100% by the late 21st century with high emissions. The SHP fares worst with respect to drought. Nonetheless, despite the overall trend toward a drier world, extreme rainfall shows a pronounced yet uncertain, increase in frequency and magnitude. A very large degree of spread is apparent from the models, anywhere from no change (in two cases) to a 100-year rainfall in the past being the 5-year rainfall of the future! A major stressor posed by this scenario is the high degree of precipitation variability on multiple scales.
Question 2: What are the projections associated with each climate scenario, and how do they differ by sub-domain?
As you would expect, the largest differences exist between Hot/Dry and Warm/Wet. Hot/Dry projects the most significant decreases in precipitation and increases in drought frequency, more so with high emissions and for the SHP domain. In contrast, Warm/Wet models show the smallest change in drought frequency, and no change for the eastern two sub-domains using mid-range emissions. However, with high emissions, even this scenario increases frequency of drought by up to 50%, especially for the SHP. Extreme precipitation increased in magnitude regardless of scenario, and, importantly, there was no statistically significant distinction between the magnitude and frequency of extreme precipitation from Warm/Wet models versus any other scenario, including Hot/Dry.
I refer to the Warm/Wet scenario as ‘We have water…most years.’ This scenario tends to preserve the historical average precipitation unless emissions are high, and it’s the late 21st century, and you’re in the SHP. Nonetheless, increased drought is possible throughout the region, more so with high emissions, where its frequency can increase 30-50%. The 100-year rainfall increases in magnitude and frequency, being the 5-30 year event in the future. The primary stressor for this scenario would most likely be associated with abundant rainfall and flooding.
The Hot/Dry scenario is ‘We don’t have water…most years.’ This scenario substantially reduces seasonal average precipitation, particularly during the warm season, as well as increasing drought frequency, in the worst case by up to a factor of 4! Extreme precipitation also increases, with a 100-year storm being the future 12-30 year storm, and the relative contribution of the top 2% of events to the annual total increases, suggesting protracted dryness interspersed with episodes of intense rainfall. In this case, our primary stressor is sustained and severe drought, however intense precipitation in such an environment would lead to runoff and flooding concerns.
Key points to take away:
- ALL future climate scenarios for Oklahoma and Texas are ‘Feast and Famine’ or high variability, it’s just some lean towards one or other of those two poles a little more than others. A ‘Dry’ scenario is NOT exclusively dry, not a Wet one always wet, each contains elements of the other.
- The projections for drought are very closely related to the emissions scenario, indicating how drought is closely linked with temperature change. A hotter world will result in higher amounts of evapotranspiration which can increase drought risk even if future precipitation did not change.
- Projections for extreme precipitation tend to rely most on the specific climate model, and show pronounced changes even in the mid-21st century, and are less distinctly sensitive to emissions scenario. If we take this as truth, this would mean that heavy precipitation events would ramp up in their frequency and intensity substantially in the next few decades in the OK/TX region, quickly rendering historical design guidance (e.g., using return periods) as insufficient.
Where next?
This work can help to inform decision-makers of the climate-related risks in their regions, but it does not do any more than that. To solve specific problems and make robust decisions for infrastructure and services under climate change, decision-maker and researcher must take opportunities to work together and pool their skill-sets. This is one of the avenues I’d love to explore. My current and planned work examines heavy precipitation across regions at multiple scales, looking at improving our understanding of processes contributing to extreme events in the atmosphere, and how different meteorological drivers determine the limits of what events are ‘extreme’, both historically and in the future. As is my style, I take a region approach, digging down to decision-relevant scales and using the finest temporal and spatial resolution datasets that are available and suitable.
Link to Full article: https://rmets.onlinelibrary.wiley.com/doi/abs/10.1002/joc.5979